In this fast-paced world, delays as small as a second can impact business metrics. So, a thorough analysis of performance characteristics likely causing these delays is essential. Windows Performance Analyzer offers valuable information in this regard.
The tool, which is included in Windows Assessment and Deployment Kit (Windows ADK), creates graphs and data tables of Event Tracing for Windows (ETW) events that are recorded by Windows Performance Recorder (WPR), Xperf, or an assessment that is run in the Assessment Platform. It can also open any event trace log (ETL) file for analysis. However, to do this, you’ll need to take the following actions:
- Open an ETL file in WPA
- Select Graphs
- Selecting Time Interval
- Highlighting a Selected Time Interval and Customizing a Data table
- Analysis Tab and Analysis View
- Creating and Applying a View Profile
- Searching and Filtering
- Setting User Preferences
- Using the Diagnostic Console
- View Assessment Analysis and Issue Details
Windows Performance Analyzer
1] Open an ETL file in WPA
To open an ETL file in WPA, click on the File menu, choose Open. By default, WPR saves ETL files in your Documents\WPR Files folder. However, if you have saved the file to a different location, browse to the location, and select your ETL file.
2] Selecting Graphs
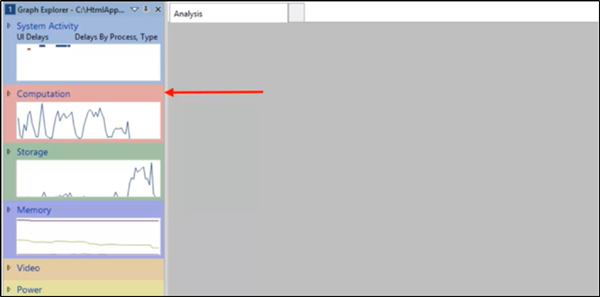
The Graph Explorer window visible on the left-hand side displays the thumbnails of all graphs that you can use to view the data of the current recording. All the graphs are grouped under several nodes. To expand a node, click the small triangle next to the node name. Alternatively, to see the full graph, drag the graph to the Analysis tab.
3] Selecting a time interval
Alongside the Analysis tab, you can find a pointer. Simply drag the pointer over the desired time interval in the graph. You can also zoom in on a time interval by right-clicking the selected time interval, and then choosing ‘Zoom to selected time range‘.
4] Highlighting a Selected Time Interval and Customizing a Data table
Assuming you have completed the above step, you can now proceed to highlight the time interval in all graphs visible under the Graph Explorer window. Simply, right-click the interval and then select ‘Highlight Selection’. The action, when confirmed, will lock the selection. Moving further, you can also customize data tables by selecting what columns to display. For example, you can open the Column Chooser box, right-click the table header and select columns individually or create or apply preset combinations of columns to display.
5] Analysis Tab and Analysis View
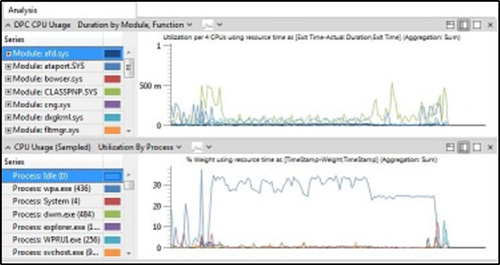
To have a clear view of the desired graph with the associated summary tables, drag the graph from the Graph Explorer window onto the Analysis tab.
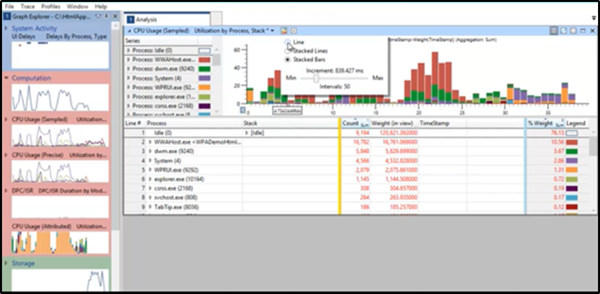
When you drag a graph from the Graph Explorer window to the Analysis tab, the graph appears together with a Legend control on the left. The Legend control provides information about the lines or bars in the graph. If you want to see the same data in tabular form, click the right-most layout icon on the graph title bar.
You can use the right drop-down arrow on the graph title bar to change from a line graph to a-
- stacked-line graph or
- stacked-bar graph
The left drop-down arrow on the graph title bar gives valuable information about different parameters for the graph like CPU usage by process, by CPU, or by process and thread. If you would like to view some graphs on a different timeline, you can open an additional Analysis tab. For this, click New Analysis View on the Window menu, and then drag the desired graphs to the new tab.
6] Creating and Applying a View Profile
Once you have the desired layout of the Analyzer with you, you can proceed to create a view profile that opens or launches the same layout as the current one every time you open WPA or only for specific occasions. So, go to ‘Profiles‘ menu and click ‘Export’ to create a view profile. Later, click ‘Apply’ to give the authorization to a ‘View Profile‘ that you previously created, or hit ‘Save Startup Profile’ to view the current layout view every time that you open WPA.
7] Searching and Filtering
You can filter the data in a graph by right-clicking the graph ‘Legend’ control and enabling or disabling the desired items. To allow only the selected row/s to be seen, right-click the data table, and choose ‘Filter To Selection‘ option. Also, to select the columns to display in the data table, right-click the table header, and then select or clear the columns in the ‘Column Chooser’ box.
8] Setting User Preferences
Configure Windows Performance Analyser to load symbols, and set symbol paths. These options can be readily accessed via the ‘Trace’ menu.
9] Using the Diagnostic Console
As the name suggests, this window lists exceptions that occurred in the analysis workflow so that you can diagnose them from the console.
10] Viewing Assessment Analysis and Issue Details
You can also search the list of issues by using the ‘Search‘ options at the top of the Issues window. This is possible when you have chosen to run an assessment from the Assessment Platform.
Upon selecting it, the ‘Details’ window shows details of that issue, with recommended solutions. To see a summary report of all of the issues that need investigation, see the ‘Issue Details’ section at the bottom of the ‘Analysis’ tab
You can learn more about this on Microsoft.com. The tool is now also available in the Microsoft Store.


Add Comment